Diagramming Tools
Simple Tools
Agile software development approaches advocate use of the simplest tools possible that allow a team to meet its goals. Rather than reaching immediately for a software application to draw your diagrams, consider whether simpler tools might be easier and more inclusive.
When your team is able to gather in one place, tools such as whiteboards, flipcharts, Post-it notes and index cards can be very effective at facilitating collaborative design and diagramming activities. There is no learning curve to negotiate when using them, and diagrams can be redrawn quickly and easily as the team explores different design ideas.
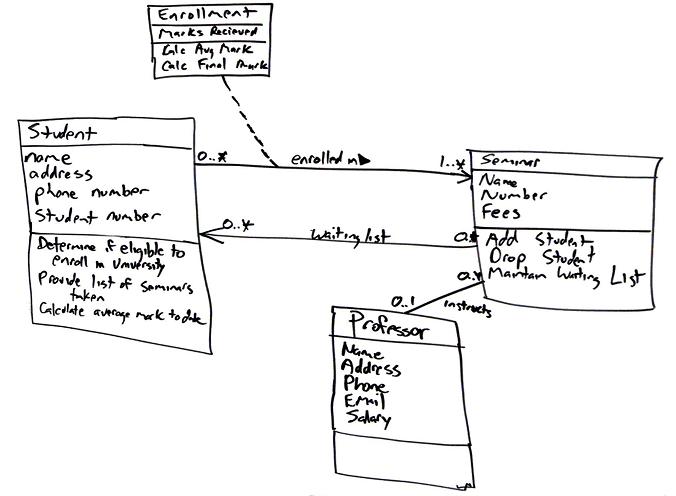
(Hand-drawn class diagram from Agile Modeling, by Scott Ambler)
When you’ve agreed on a diagram, it isn’t necessary to redraw it ‘nicely’ using a software application. If it is neat enough and legible enough, you can simply capture a photo of it with your phone and upload that photo to wherever your team stores its shared documentation.
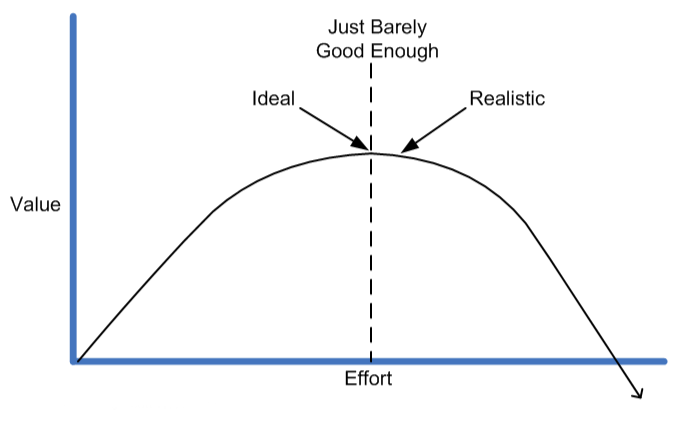
This is an example of the ‘just barely good enough’ concept. Expending effort on diagramming adds value up to a certain point; beyond that point, the value of additional effort diminishes. That extra effort would be more usefully spent on analysis of other use cases, or the actual implementation of classes.
draw.io
Although simple physical tools can be the best option for collaborative development, sometimes it is useful to produce something more polished, using a software tool.
draw.io is a powerful, free-to-use diagramming tool that runs in your browser. You can also run it as a desktop application or as a VS Code extension.
This tool is not limited to UML modelling activities. It can create many different types of diagram, including ER diagrams, network infrastructure diagrams, and user interface mock-ups. You may find some of these useful in the Semester 2 project.
Diagrams can be saved locally to your PC or to cloud storage (Google Drive, OneDrive, GitHub). Saved diagrams are text files, in an XML format.
Task 11.4.1
-
Watch the quick-start tutorial on using draw.io:
-
Run the draw.io browser application. Click the Create New Diagram button.
-
Specify
student.drawioas the filename. Leave the diagram template set to ‘Blank Diagram’, and click the Create button. When prompted for a save location for the filename, choose thetask11_4_1subdirectory of your repository. -
Click on the ‘UML’ menu item in the panel on the left of the application window, to open up the list of UML diagram elements provided by draw.io.
Note: If you don’t see a ‘UML’ menu item, click on the More Shapes button at the bottom of the panel, and tick the ‘UML’ checkbox (NOT the checkbox for ‘UML 2.5’).
-
Drag the diagram element labelled ‘Class’ from the list of diagram elements into the canvas in the centre of the application window. Double-click on the top compartment of the class and change its name to
Student. -
Double-click on the middle compartment. Edit the class attributes to match those of the
Studentclass shown on the design-level class diagram in the previous section.Note: you’ll need to resize the attributes compartment so that all of the attributes are visible.
-
Follow the same process to recreate the
Moduleclass from the design-level class diagram. Be sure to include operations here, as well as attributes. -
Link the two classes with an association. To do this, hover the cursor near to an edge of the
Studentclass. When you see a blue arrow, click and draw the connection to theModuleclass.Once the two classes are connected, select the association and remove the navigability arrowhead (use the settings in the panel on the right of the application window to do this).
Then double-click on the middle of the line and enter “enrols on” as the label for the association. After providing the label, drag it to just above or just below the line.
-
Finally, use ‘Export As…’ on the ‘File’ menu to export the diagram as a PNG image. On the pop-up dialog of options, choose a Zoom Factor of 150% or 200%, for a larger, higher-quality image. Specify a Border Width of 5. Then click on the Export button.
Specify
student.pngas the filename when prompted, and make sure that the image is saved into thetask11_4_1subdirectory of your repository. Then examine the exported image.
Mermaid
Mermaid is a JavaScript library that transforms a text-based specification of a diagram into a graphical representation that is displayed in a web browser.
Like draw.io, it can draw many different types of diagram, not just UML diagrams.
Here’s an example of a class diagram specified in Mermaid:
classDiagram
  Student -- Module : enrols on
  class Module {
    moduleCode: String
    title: String
    numCredits: Int
    enrolStudent(student: Student)
    generateTranscript(student: Student)
  }
  class Student {
    id: Int
    name: String
    degreeProgramme: String
    levelOfStudy: Int
  }
And here is the diagram that Mermaid generates from that specification:
classDiagram
  Student -- Module : enrols on
  class Module {
    moduleCode: String
    title: String
    numCredits: Int
    enrolStudent(student: Student)
    generateTranscript(student: Student)
  }
  class Student {
    id: Int
    name: String
    degreeProgramme: String
    levelOfStudy: Int
  }
Mermaid works particularly well as a way of embedding diagrams into Markdown documents1. GitHub supports Mermaid, so if you put Markdown files containing Mermaid diagrams in your repository, those diagrams will be rendered when you view the files on github.com in your browser.
This also applies to documents put into a GitHub wiki. This may come in handy in Semester 2, when you are preparing the software design documents for your group projects!
You can create Mermaid diagrams in a more interactive way using the Mermaid Live Editor or the full Mermaid Chart app. You can then copy the code from these tools and paste it into the document where you want the diagram to appear; alternatively, you can export your diagram from these tools as a PNG image or SVG document.
For a deep dive into the use of Mermaid in software development, see the book Creating Software With Modern Diagramming Techniques, by Ashley Peacock.
Task 11.4.2
-
Study Mermaid’s class diagram documentation. Focus on the first few sections (Syntax, Define a Class, Defining Members, Defining Relationships).
-
Use the Mermaid Live Editor to create a class diagram that has the following features:
- A class
Customer, with- Attributes
nameandaddress - A single operation named
placeOrder
- Attributes
- A class
Order, with- Attributes
orderNumber,datePlacedanddeliveryDate - Operations
checkStockandtakePayment
- Attributes
- A class
OrderItem, with attributesnameanddescription - An association between
CustomerandOrder, labeled “places” - An association between
OrderandOrderItem, labelled “includes”
Do not put any details of attribute types or operation parameters on your diagram.
- A class
-
Edit the file
mermaid.md, in thetask11_4_2subdirectory of your repository. Note the lines that need to be replaced, as indicate by the comment line beginning with%%.Copy the Mermaid diagram specification from the live editor and paste it into
mermaid.md, replacing the indicated lines. -
Commit your changes to
mermaid.mdand push them to GitHub. Then go to your repository’s home page on github.com and view the file. You should see the diagram and the other content of the document properly rendered.
-
This is how we have used it in these teaching materials. The source files for the web pages that you’ve been reading are all Markdown documents. Most of the UML diagrams that you’ve seen on these pages are generated from Mermaid specifications embedded in those documents. ↩